
> At a Glance
> – Ethereum cleared a daily symmetrical triangle with a measured target near $3,700
> – A tight 3-day Bollinger Band squeeze signals an imminent volatility spike
> – US demand is lagging; the Coinbase Premium Gap has fallen to -2.285, its lowest since early 2025
> – Why it matters: The technical setup is bullish, but weak American institutional flow could cap short-term gains
Ethereum is flashing conflicting signals as 2026 trading begins. Price action has triggered two classic breakout patterns, yet on-chain data shows US institutions stepping back. Traders are now watching whether technical momentum can outweigh fading American demand.
Triangle Breakout & Band Squeeze
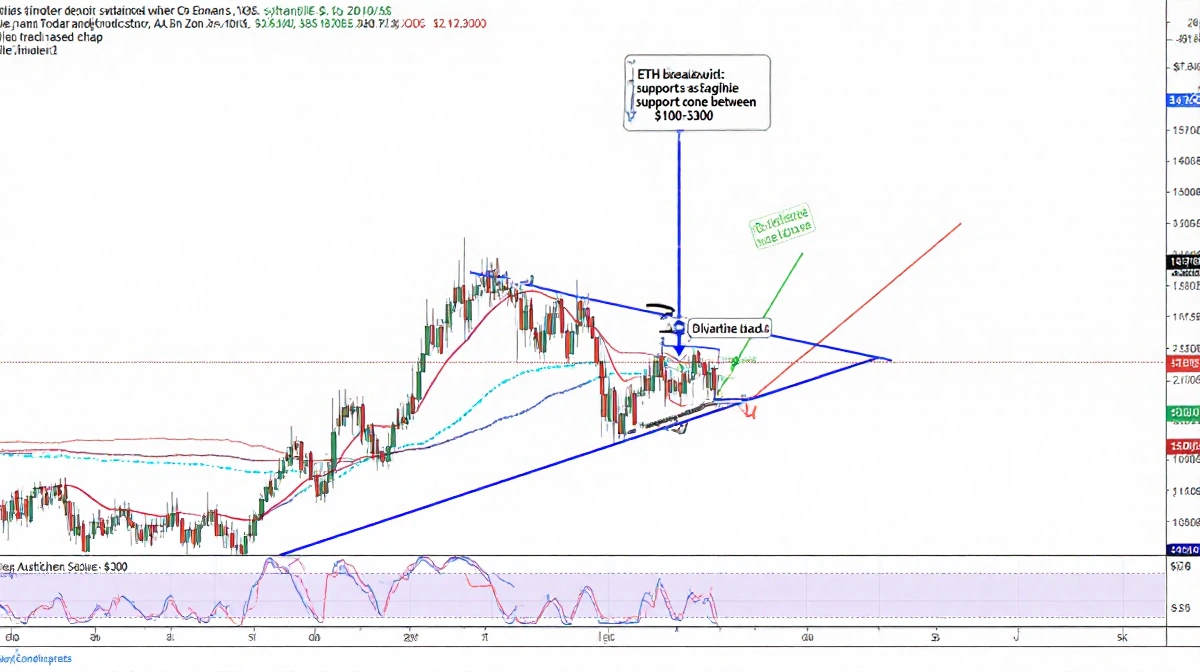
The daily chart printed a clean break above the upper trendline of a multi-week symmetrical triangle. Chartist Ali Martinez flagged the move, noting the pattern’s height projects a move toward $3,700 as long as ETH remains above the $3,100-$3,300 support zone.
On the 3-day timeframe, Bollinger Bands are pinching tighter than at any point since late 2025. Analyst Bryant compared the setup to a prior squeeze that preceded Ethereum’s run from $1,800 to $4,900. He pointed out that only one of two required whale-indicator signals has triggered so far; the second remains inactive.
> “The Bollinger Bands are squeezing tightly, meaning that a BIG move is coming soon.”
> – Bryant, market analyst
- Triangle base support sits at $2,800
- Invalidation level for the breakout: daily close below $3,100
- Long-term cycle targets from some analysts remain above $10,000
On-Chain Split: Supply Down, US Demand Down
Exchange balances tell a bullish tale. Data from CryptoQuant shows total ETH on platforms has dropped below 16.5 million-among the lowest readings in years-reducing immediate sell pressure.
Yet American appetite is cooling fast. The Coinbase Premium Gap, which measures the price difference between Coinbase and Binance, has plunged to -2.285 on a 14-day average. Analyst CryptoOnchain says the level is the most negative since early 2025, implying US institutions are either absent or selling into strength.
| Metric | Current Reading | Implication |
|---|---|---|
| Exchange reserves | <16.5M ETH | Lower near-term supply |
| Coinbase Premium Gap | -2.285 | Weak US institutional demand |
| Triangle target | ~$3,700 | Bullish if support holds |
Key Takeaways
- Ethereum’s technical picture is primed for a volatility expansion
- A confirmed triangle breakout targets $3,700 with support at $3,100
- Dwindling US demand could blunt follow-through despite supply shrinkage
With Q1 historically strong for ETH after weak year-end finishes, traders are balancing a sturdy chart setup against the reality of fading American buying.