Bitcoin’s price action has narrowed into a tight range just below a major resistance cluster, setting up a breakout-or-breakdown moment that could decide market direction for weeks.
At a Glance
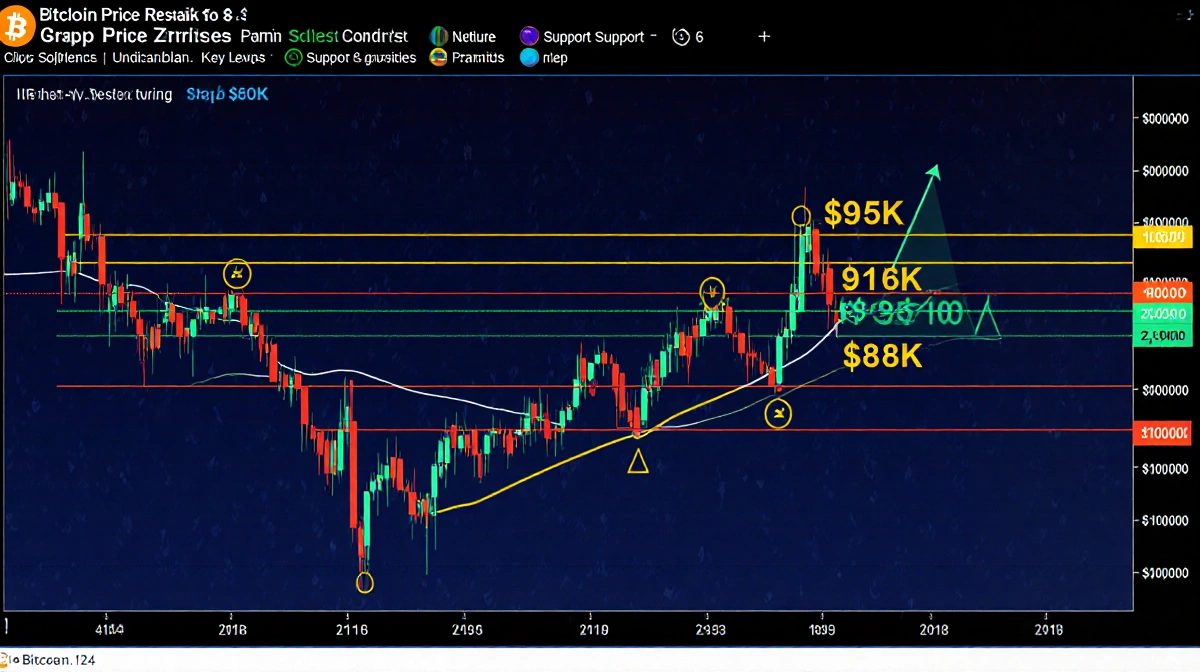
- Bitcoin is consolidating below daily moving averages near $95K
- The 4-hour chart shows a rising wedge pressing into resistance
- Futures data shows heavy retail activity while larger players stay quiet
- Why it matters: A decisive move above $95K or below $88K will likely set the next major trend
Bitcoin’s correction is entering its most critical phase. The price is wedged between a descending 200-day moving average and a rising support line from the November low. Which side gives way first will determine whether the crypto reclaims six-figure ground or slides back toward the mid-$80Ks.
Daily Chart: $95K Ceiling Holds Firm
The daily chart places Bitcoin below both the 100-day and 200-day moving averages, currently clustered around $94.5K-$95.2K. This zone has acted as supply resistance since early December, rejecting rallies on four separate occasions.
Yet bears have not managed to break the pattern of higher lows:
- November low: $88.4K
- December low: $90.1K
- January low: $91.2K
As long as the most recent pivot low near $91K holds, the structure remains a broad ascending triangle rather than a new downtrend.
Key Levels to Watch
| Level | Significance |
|---|---|
| $95K | Horizontal resistance + 200-DMA |
| $91K | Recent higher low |
| $88K | November swing low |
A daily close above $95K would trigger a rapid move toward the next supply block just above $100K, while a breakdown below $88K would invalidate the bullish sequence and expose the $80K region.
4-Hour Chart: Rising Wedge Meets Overbought RSI
Zooming in, the 4-hour timeframe reveals a textbook rising wedge that has carried price from $90.1K to $94.8K over the past two weeks. Volume has steadily declined during the climb, a classic signature of a corrective pattern.
Momentum indicators are flashing caution:
- RSI tagged 74 on the last push and has since rolled over
- MACD histogram printed a lower high while price printed a higher high
- Open interest rose 8% during the climb, funded mostly by retail-driven perpetual contracts
The wedge’s upper trendline currently intersects the $95K horizontal shelf. A breakout would need to be accompanied by a surge in spot volume to avoid the fakeout traps that have characterized recent months.
Scenario Map
Breakout case:
- Close above $95K on volume > 1.5× the 20-day average
- Follow-through toward $100K-$102K within 48 hours
- Invalidation only on daily close back below $93K
Rejection case:
- Reversal from $94.5K-$95K zone
- Drop toward wedge support near $91K
- Break of $90K opens $88K retest
Sentiment: Retail Crowds Resistance While Whales Wait
Futures markets reveal a growing divergence. Average order size on major perpetual swaps has fallen to $6.8K, the lowest since September, indicating the recent uptick is dominated by smaller traders. Larger position tickets (> $50K nominal) dropped 22% compared with December’s average.
Exchange data compiled by News Of Losangeles shows:
- Retail long bias at 68% near $94K
- Funding rates turning positive but still below October extremes
- Options open interest for $100K calls expiring January 31 rising to $1.2B notional
This setup-retail-heavy longs clustered just under resistance-has historically led to volatile whipsaws rather than clean breakouts. A purge of weak longs via a swift drop to $88K-$90K could reset conditions for a more sustained move higher.
Macro Backdrop Keeps Bulls Guarded
External catalysts remain mixed. U.S. dollar index (DXY) is hovering at 108, near a two-year high, while the 10-year Treasury yield hovers around 4.8%. Both factors have capped risk appetite across global markets, yet Bitcoin has managed to hold its range, suggesting underlying bid interest.
Equity futures are pricing a 96% probability of no change at the next Fed meeting, reducing the likelihood of a hawkish surprise that could jolt risk assets. Still, correlation with Nasdaq has crept up to 0.58 over the past 30 days, the highest since July, leaving BTC vulnerable to any sharp tech selloff.
What Traders Are Saying
“
We’re watching the 4-hour wedge and the daily MA cluster converge at $95K-a break either way will likely run 5%-7% quickly,” said Markus, a derivatives trader at a major crypto fund. “Right now, the risk-reward favors waiting for confirmation rather than front-running.
“
The market is balanced on a knife edge,” added Lily, market strategist at a leading exchange. “A clean breakout needs institutional flow; otherwise, we’ll see another fakeout and a drop toward $90K to shake out the crowded longs.
Key Takeaways
- Bitcoin’s daily structure keeps higher lows intact, but $95K resistance has rejected price repeatedly
- The 4-hour rising wedge points to an imminent expansion; breakout target is $100K+, while failure opens $88K
- Retail-dominated futures positioning raises the odds of a volatility spike rather than a smooth trend
- Confirmation will come from a high-volume daily close above $95K or below $88K