At a Glance
- XRP/USDT rejected at $2.40, now testing the $2.00 pivot
- XRP/BTC slides to 2,150 sats after 2,500 sats failure
- Daily RSI cooling from overbought levels across both pairs
Why it matters: Another daily close beneath $2.00 and 2,000 sats could trigger deeper corrective moves toward the January lows.
XRP’s early-month rebound has stalled. The token is now trading in a corrective environment against both Tether and Bitcoin, with technical signals pointing to renewed selling pressure rather than a trend reversal.
USDT Pair: $2.00 Pivot in Focus
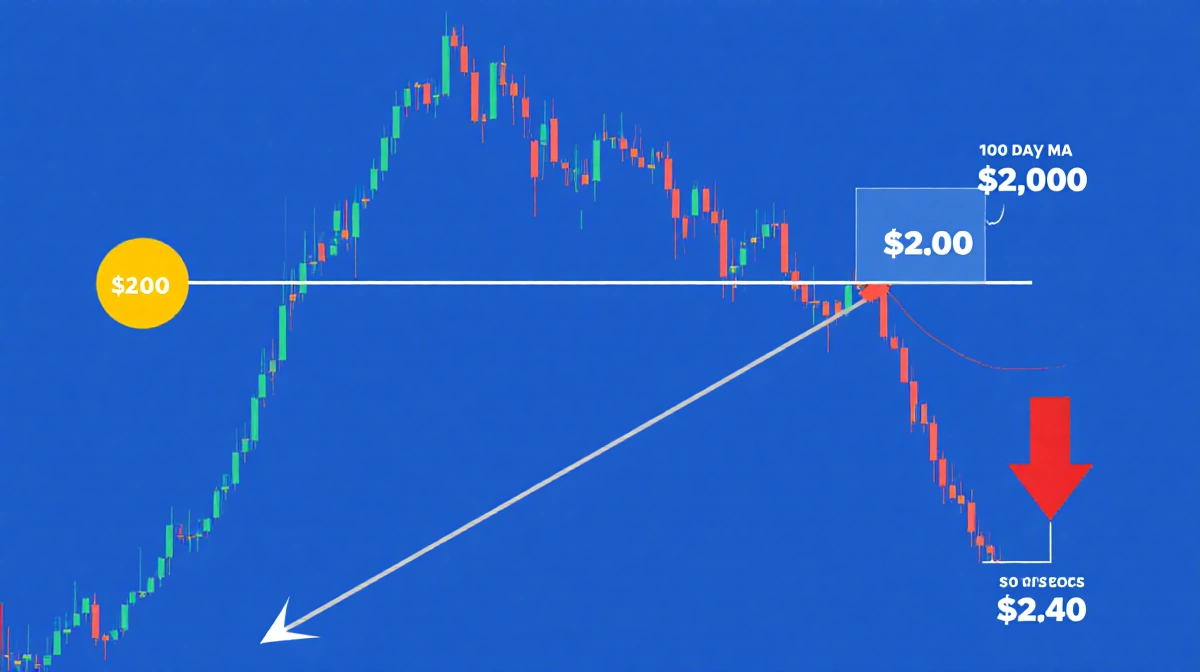
The daily XRP/USDT chart shows price recently bounced from the $1.80 support band. Buyers pushed the asset into the $2.40 supply zone where it met the declining 100-day moving average (MA). Price remains well below the 200-day MA near the upper part of that resistance block.
The rejection from this confluence, together with a cooling daily RSI after an overbought push, indicates the market has transitioned from impulse to consolidation or corrective pullback.
Short-term structure now hinges on the $2.00 region:
- Holding above preserves a constructive higher-low formation
- Keeps open the prospect of another attempt at $2.40 and, later, a test of the 200-day MA
- A daily close back below roughly $2.00 would signal selling pressure is re-establishing control
- Such a break increases the probability of a deeper retracement toward the $1.80 demand zone where the prior base formed
BTC Pair: Continuation Pattern Remains
XRP’s performance against Bitcoin looks even weaker. The daily XRP/BTC pair printed a clear rejection from the 2,400-2,500 sats resistance band. This area coincides with the key 200-day MA and a prior distribution zone.
After the failed breakout:
- Price rotated lower and now trades around 2,150 sats
- Daily RSI has rolled over from a local peak
- Behavior is typical of continuation within the existing downtrend
- Rallies into the moving averages keep attracting supply
If current weakness persists, the next notable technical support lies near 2,000 sats. Only a sustained recovery back above the 2,400 sats region, coupled with a break and hold above the daily moving averages, would indicate a material shift in relative strength.
Such a shift would open the way for a larger mean-reversion phase favoring XRP against Bitcoin. Until then, structural underperformance continues.
Key Levels to Watch
| Pair | Immediate Support | Immediate Resistance | Bullish Trigger |
|---|---|---|---|
| XRP/USDT | $2.00 | $2.40 | Daily close above 200-day MA |
| XRP/BTC | 2,000 sats | 2,500 sats | Hold above 200-day MA |
Key Takeaways
- XRP/USDT needs to defend $2.00 to avoid a retest of $1.80
- XRP/BTC remains in a structural downtrend with resistance at 2,500 sats
- Daily RSI cooling suggests further consolidation before the next directional move
- Relative strength continues to favor Bitcoin over XRP until proven otherwise