
Ethereum is quietly grinding higher after December’s rebound, but it’s now parked beneath a stubborn resistance band between $3.3K and $3.5K that has rejected every rally since early 2023. The next few daily closes will decide whether buyers punch through or sellers shove the second-largest crypto back into its months-old range.
At a Glance
- ETH has climbed from the $2.7K demand zone and is retesting the $3.3-$3.5K supply wall
- Active addresses just hit a 12-month high while price still lags below prior peaks
- A daily close above $3.5K would target $4K, while a drop under $3K risks a slide to $2.5K
- Why it matters: A breakout here could ignite the next leg of the crypto rally; a rejection would trap late longs and cool sentiment across the broader market
Daily Chart: Price Meets 100-Day Moving Average
The daily chart shows ETH spring-loading inside a clear structure: higher lows since September and a ceiling that has held five separate tests. The 100-day moving average sits exactly inside the $3.3-$3.5K box, giving bears a technically sound place to defend.
Above that, the 200-day moving average waits near $3.7K, forming the next dynamic hurdle if bulls succeed. Below, the $3K pivot marks the line in the sand-lose it and the chart flips from accumulation to distribution, with the last major demand cluster at $2.7K.
Volume has risen on each push higher, but not yet enough to register a decisive breakout. The RSI is creeping toward overbought without crossing, leaving room for one more spike if buyers step in with size.
What Could Tip the Scale
- A daily close above $3.5K on volume >$15 billion would open a quick path to $4K
- Failure to hold $3K on a closing basis would likely send price back to the $2.7K support block
- The 100-day MA has acted as resistance since March; flipping it to support is the bulls’ main objective
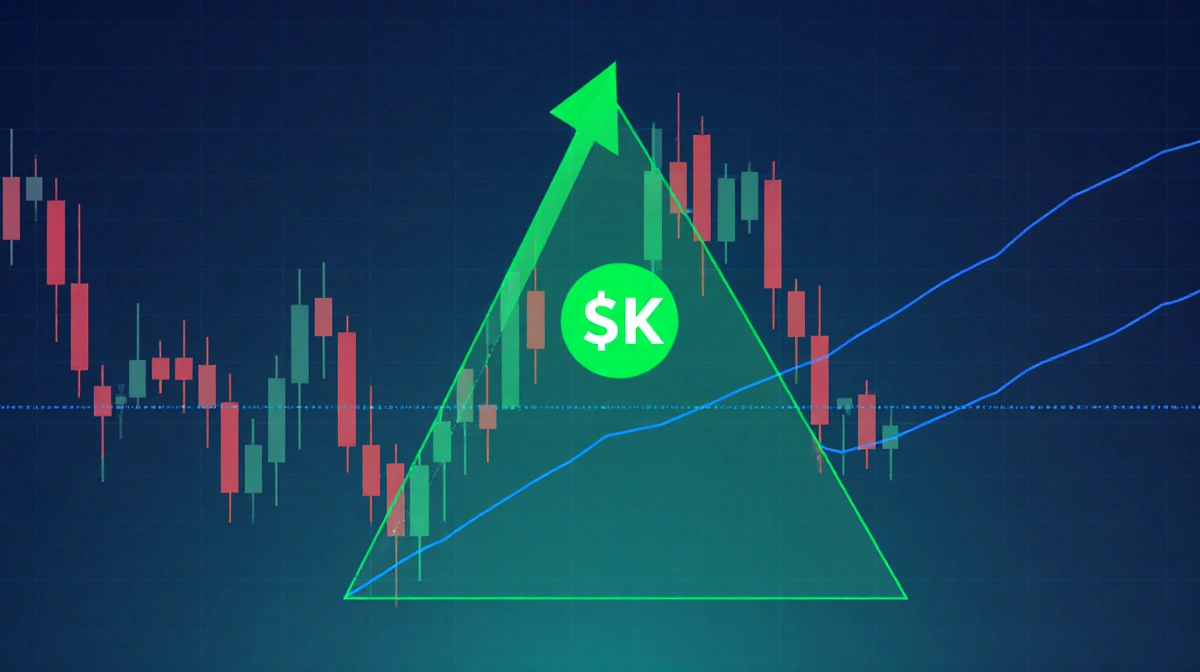
4-Hour Chart: Symmetrical Triangle Breakout Test
Zooming in, ETH escaped a three-week symmetrical triangle that had compressed price between higher lows and lower highs. The measured-move target of that breakout lines up with the top of the blue band at $3.4K, where the market is currently stalling.
The 4-hour RSI printed a bearish divergence at the last peak, explaining the sideways drift of the past 48 hours. Short-term support rests at $3K, followed by the rising trendline at $2.9K. Losing both would hand momentum back to sellers and put the late-December low of $2.5K back in play.
| Key 4-Hour Levels | Price |
|---|---|
| Resistance | $3.4-3.5K |
| Support 1 | $3.0K |
| Support 2 | $2.9K |
| Support 3 | $2.5K |
On-Chain: Active Addresses Hit Yearly High
The 30-day moving average of Ethereum active addresses has broken above the highs set during the April 2023 rally, registering a 12-month peak even though ETH price remains well below its local top from that period. Historically, such divergences resolve in one of two ways:
- Price plays catch-up, surging to align with network demand
- Activity fades as profit-taking triggers a rejection, sending both metrics lower
Exchange reserves have dropped by $800 million since mid-December, suggesting coins are moving to cold storage-typically a constructive sign. However, funding rates have turned slightly positive, indicating leveraged longs are building just under resistance, a setup that can fuel volatile moves in either direction.
| On-Chain Metric | Current Value | 30-Day Change |
|---|---|---|
| Active Addresses (30d) | 532K | +11% |
| Exchange Balance | 18.4M ETH | -4.2% |
| Funding Rate (8h) | +0.012% | +0.009% |
Sentiment: Retail Quiet, Whales Accumulating
Data compiled by News Of Los Angeles show that wallets holding 100-1,000 ETH have added 1.2 million coins over the past six weeks, the fastest pace since October 2022. Meanwhile, smaller wallets (<10 ETH) have barely moved, signaling that retail interest remains tepid.
This whale accumulation under a major resistance zone mirrors patterns seen before the May 2021 and March 2023 breakouts. The caveat: each of those precedents also coincided with a sharp rise in social-media buzz, something that has yet to materialize this cycle.
Macro Tailwinds and Headwinds
Global dollar liquidity has expanded for three straight weeks, a backdrop that has historically benefited crypto. At the same time, U.S. short-term yields remain above 5%, keeping pressure on risk assets and limiting the pool of idle cash willing to chase a breakout.
Ethereum’s next protocol upgrade, Dencun, is slated for early 2024 and will introduce proto-danksharding, a change expected to cut L2 fees by up to 90%. While the upgrade is not yet priced in according to most analysts, its proximity adds a potential catalyst should price clear technical resistance first.
Key Takeaways
- ETH sits at a critical junction: a weekly close above $3.5K would confirm a new uptrend with $4K in sight
- The daily and 4-hour structures are bullish as long as $3K holds on a closing basis
- On-chain activity is surging, but history warns that spikes under resistance can precede either a breakout or a local top
- Whale wallets are accumulating while retail stays sidelined, a setup that has preceded large moves in the past
- The next 5-7 trading days are likely to decide the direction for the first quarter