At a Glance
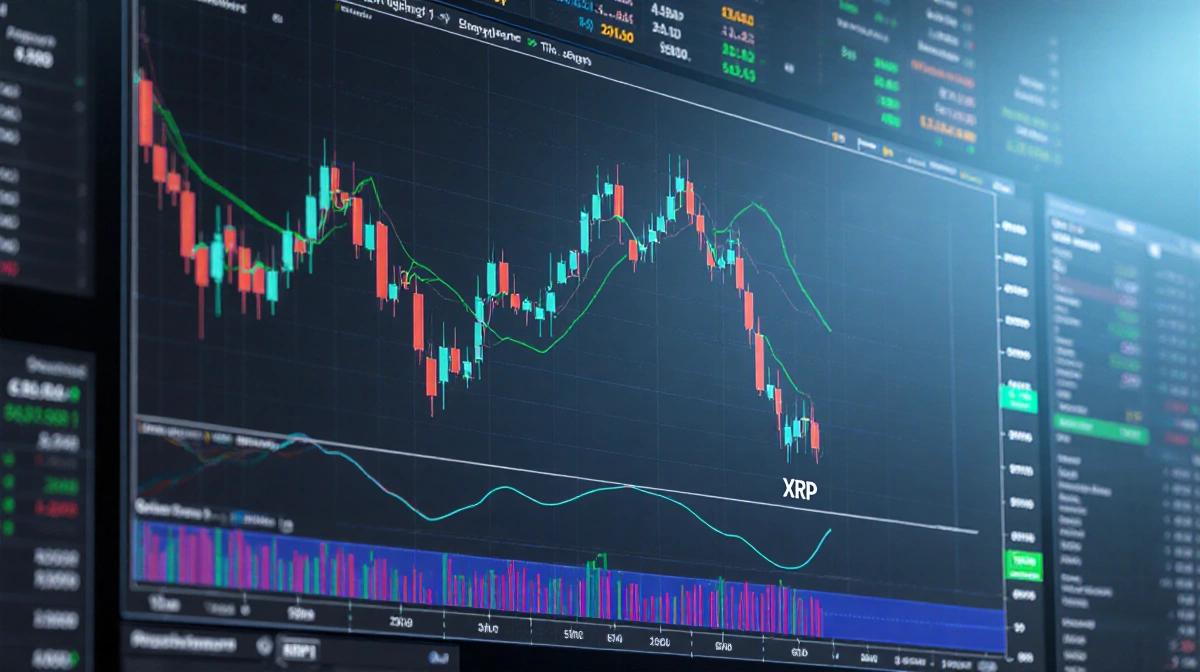
- XRP slid to $1.91 after a 2% decline.
- CVD correlation with price is 0.61, positive but CVD itself remains negative.
- Spot XRP ETFs attracted $2.09 million in net inflows on January 22.
- Why it matters: Traders face a base-building phase with unclear buying power.
XRP slipped to $1.91 after a fresh 2% decline on Friday, leaving traders uncertain about future direction. While the cumulative volume delta (CVD) remains negative, the positive correlation between price and volume at 0.61 suggests an underlying structural trend. Meanwhile, spot XRP ETFs continued to attract capital, pulling in $2.09 million on January 22, indicating that institutional demand persists despite retail pessimism.
XRP’s Price Decline
The last session saw XRP fall 2% from its previous close, bringing the price to $1.91. This move followed a series of weaker days that have eroded market conviction. Analysts note that the lack of a clear upward catalyst keeps the price range tight.
Retail sentiment has tightened, with social-media analysis showing an “Extreme Fear” designation after the drop from the January 5 high. The analytics firm Santiment highlighted that heavy bearish commentary often precedes rallies, and prices have frequently moved opposite to retail expectations. This pattern has led some observers to view the current fear level as a potential precursor to a rebound.
The 2% decline is part of a broader trend of volatility that has seen XRP trade within a narrow band over the past week. This pattern suggests that the asset is consolidating rather than breaking out.
Analysts have cautioned that a further drop could test the $1.78 support level. If that level holds, traders may view the move as a temporary correction rather than a significant reversal.
Cumulative Volume Delta Analysis
Cumulative Volume Delta (CVD) tracks the net difference between buying and selling volume over a set period. CryptoQuant’s analysis of Binance’s XRP market shows a 30-day price-CVD correlation of about 0.61. This moderate-to-strong positive relationship means that recent price action has stayed closely aligned with trading activity.
Because the latest CVD reading remains in negative territory, the indicator is treated as a “confirmation score” rather than a direct trading signal. It assesses the strength and coherence of the ongoing trend without offering explicit entry or exit points. This approach helps traders gauge whether the market is consolidating or moving decisively.
The CVD tool is useful for spotting divergence. A scenario where prices rise while the correlation weakens or negative CVD persists would point to emerging internal weakness. In the current setup, however, the continued presence of a positive correlation despite ongoing price softness suggests a base-building process rather than an aggressive distribution.
CryptoQuant also noted that the positive correlation indicates that price moves are supported by volume. This alignment reduces the likelihood of a false breakout.
The confirmation score, derived from negative CVD, signals that the trend is still developing. Traders often wait for a positive CVD before committing large positions.
Volume Flow Dynamics
New data indicates that XRP is not decoupling from volume flows. Selling pressure has not yet fully transitioned into net buying dominance. This dual condition defines the indicator as a “confirmation score.” It reflects internal consistency between price and volume rather than a short-term reversal.
The persistence of negative CVD, combined with a positive price-volume correlation, signals that the market may still be in a preparatory phase. Traders often interpret such signals as a period of accumulation, where buyers are gradually building a position without a pronounced price move.
The dual condition of negative CVD and positive correlation is relatively rare in XRP’s recent history. It may indicate that the market is in a waiting mode.
Some traders interpret this as a sign that buyers are accumulating quietly. Others view it as a warning that the market could still move sharply downward.
FUD and ETF Activity
Retail sentiment has turned bearish, but institutional activity tells a different story. SoSoValue data shows that spot XRP ETFs recorded $2.09 million in net inflows on January 22. This inflow indicates that ETFs are still attracting fresh capital, even as the broader market hesitates.
Santiment’s observation that “major FUD is usually a rally starter” highlights a pattern where negative sentiment can precede a rebound. While the current environment is cautious, the historical relationship between FUD and price movement suggests that a reversal is not impossible.
The $2.09 million inflow into spot ETFs on January 22 is significant given the recent decline. It shows that investors are still willing to add positions.
The inflow also provides liquidity that can help absorb selling pressure. This liquidity may dampen price swings in the short term.
Key Levels and Support
Analyst Ali Martinez identified critical price zones to monitor. He said that $1.78 is a crucial support level for XRP. If the asset holds above this level, the next major resistance areas are around $1.97 and $2.00. Traders often use these thresholds to gauge potential breakout or breakdown points.
| Level | Type | Significance |
|---|---|---|
| $1.78 | Support | Holds the price from falling further |
| $1.97 | Resistance | Possible ceiling if buying pressure increases |
| $2.00 | Resistance | Psychological barrier and potential rally trigger |
The support level at $1.78 has held up in recent sessions, preventing a deeper slide. A breach below this zone would likely trigger a sharper decline and could force traders to reassess their positions. Conversely, a sustained rally past $1.97 could signal a shift toward a bullish trend.
The $1.97 resistance level is also a psychological barrier. Many traders set sell orders around this price.
If the price breaks above $2.00, it could trigger a new rally. However, such a move would likely require a shift in CVD to positive.
Historical Context
XRP has historically shown a strong link between price movements and trading volume. Analysts have noted that periods of high volume often precede significant price shifts. This relationship has been a key factor in many trading strategies over the past years.
XRP’s price has previously recovered from sharp declines when volume spikes indicated renewed buying interest. However, such recoveries have typically been accompanied by a shift from negative to positive CVD readings. This pattern suggests that volume dynamics can serve as an early warning for potential trend reversals.
The current environment, where CVD remains negative while price and volume correlation stay positive, deviates from the usual pattern. Traders are therefore cautious, as the market may still be in a consolidation phase rather than a clear reversal.
Market Impact
The negative CVD indicates that selling pressure has not yet transitioned into net buying dominance. This situation can create a scenario where the market is poised for a potential breakout but remains inactive. The positive correlation between price and volume adds another layer of complexity, suggesting that buyers are still present but not yet in control.
Institutional participation, as shown by ETF inflows, can influence market dynamics by providing liquidity and confidence. When ETFs continue to bring in capital, they may help stabilize the price even if retail sentiment is bearish.
The combination of these factors creates a mixed signal for traders. While some may interpret the data as a sign of a potential rally, others may see it as a warning that the market is still uncertain.
Risk Management
- Set tight stop-loss levels just below the $1.78 support to limit downside exposure.
- Use trailing stops to protect gains if the price moves toward the $1.97 resistance.
- Monitor CVD for any shift toward positive values before committing larger positions.
- Diversify holdings to reduce concentration risk in a volatile asset.
Timeline of Key Events
| Date | Event |
|---|---|
| January 5 | XRP reached a high before the recent decline |
| January 22 | Spot XRP ETFs recorded $2.09 million in net inflows |
| Friday (date unspecified) | XRP fell 2% to $1.91 |
| Recent week | CVD remained negative while correlation stayed at 0.61 |
The timeline shows that key events have occurred in quick succession. This rapid pace can increase market uncertainty.
The correlation between price and volume remains a useful tool for traders. It helps identify periods of consolidation versus momentum.
Conclusion
XRP’s recent slide to $1.91, coupled with a negative CVD and a positive price-volume correlation, paints a picture of a market in consolidation. While retail sentiment remains bearish, institutional inflows into spot ETFs signal continued interest. Traders should watch the $1.78 support and the $1.97/$2.00 resistance levels for clues on the next directional move.
The combination of volume flow data, ETF activity, and key price levels provides a framework for assessing XRP’s short-term outlook. By monitoring these indicators, market participants can better navigate the current uncertainty and position themselves for potential future moves.
Traders should remain vigilant for any change in the CVD trend. A shift toward positive values could signal a buying surge.
Monitoring key support and resistance levels will provide additional confirmation of any potential move.