> At a Glance
> – Bitcoin has rebounded above $93,000 after weeks of downward pressure
> – Daily chart shows breakout from the October-December channel
> – 4-hour chart prints higher lows since mid-December
> – Why it matters: A sustained move above $95K could quickly target the psychological $100K-$105K zone
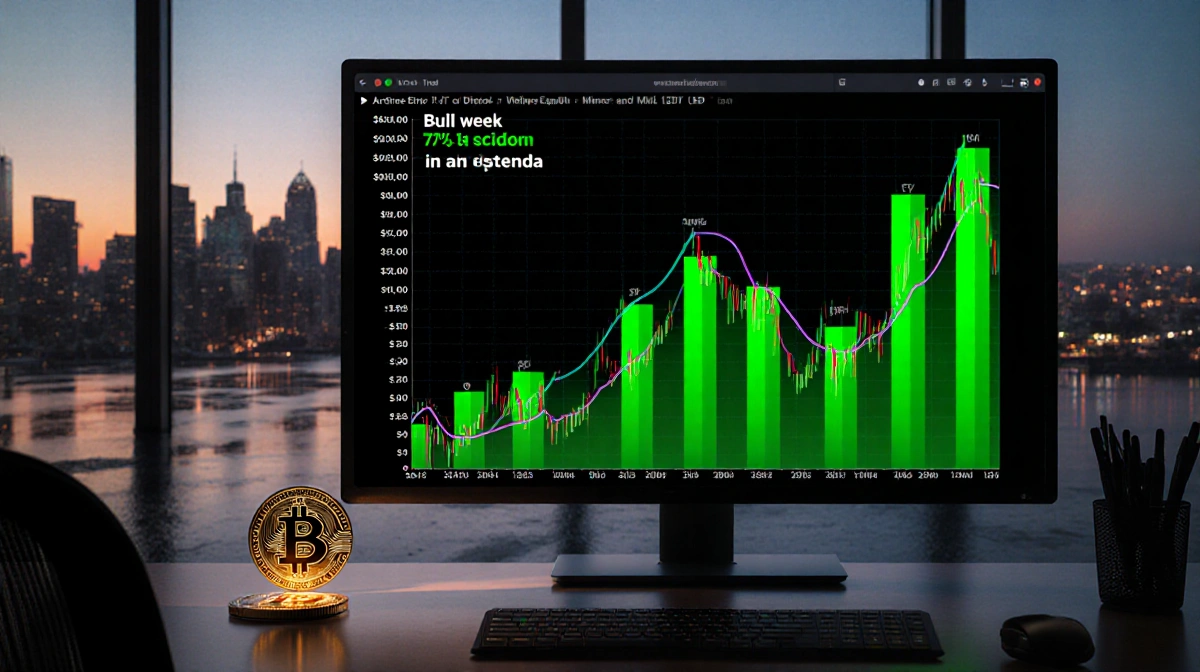
Bitcoin has clawed back above $93,000, shrugging off December’s heavy liquidation wave and a backdrop of global tension. Short-term momentum has flipped positive while futures positioning cools, setting up a test of the next major ceiling.
Daily Chart Breakout
The daily timeframe shows BTC punching out of the descending channel that capped prices since October. A sharp bounce from the $80,000 demand pocket reclaimed structure and lifted the market toward the $95,000 resistance block.
The 100- and 200-day moving averages still hover overhead, keeping longer-term pressure in place. Yet the RSI has climbed past 60, signaling buyers are in control-for now. A daily close north of $95,000 would expose the next hurdles at $100,000 and $105,000.
4-Hour Uptrend Structure
On the 4-hour chart, Bitcoin is riding an ascending channel of higher lows born in mid-December. Price is pressing the upper boundary that coincides with the daily $93K-$95K zone.
- Immediate support rests around $87,000, near recent swing lows
- While this level holds, the structural bias remains bullish
- A breakout invitation could follow if $95,000 gives way
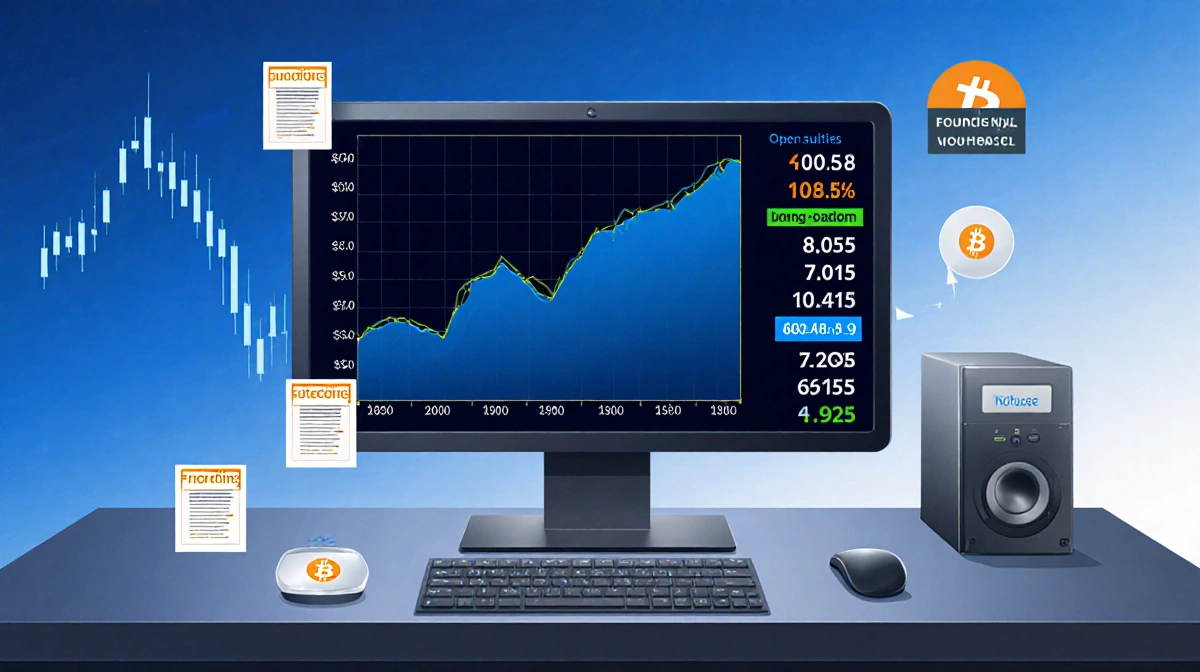
Futures Market Reset
Long liquidations have slowed dramatically since December’s cascade, according to futures data. Open interest is creeping higher while funding rates stay neutral, hinting at room for upside-barring fresh macro shocks.
| Metric | December Peak | Current |
|---|---|---|
| Long Liquidations | Extreme | Subsided |
| Open Interest | Elevated | Rising, calm |
| Funding Rate | Heated | Neutral |
The combination of reduced forced-selling risk and steady global demand sets the stage for the next directional move.
Key Takeaways
- Bitcoin’s rally reclaimed $93,000 and broke the multi-week downtrend
- $95,000 is the next major technical ceiling on both daily and 4-hour views
- Futures positioning is cleaner, lowering the odds of a sudden long squeeze
- Holding $87,000 keeps the short-term uptrend intact
With liquidation overhang fading, traders now watch $95,000 as the gatekeeper to a potential retest of the coveted $100,000 mark.