
> At a Glance
> – Bitcoin’s 3-day MACD has plunged below 2022 Luna, 2020 COVID and 2018 bear-market lows
> – Price hovers near $90,000 after sliding from Monday’s $94,600 to Thursday’s sub-$89,300
> – Analyst Ali Martinez: a daily close under $87,200 risks a fast move toward $69,230
> – Why it matters: A breach of the rising-triangle floor could spark the next major down-leg
Bitcoin’s steepest-ever selloff has driven its 3-day MACD momentum gauge to never-before-seen depths, yet the crypto is clinging to a narrow $85k-$90k range as bulls defend the 21-day moving average.
The MACD Record That Eclipses Past Crashes
Market watcher Michaël van de Poppe flagged the historic dip:
> “The MACD on the 3-Day has never been going this far down. The crash was heavier than 2022 Luna Crash, 2020 COVID Crash, or the 2018 bear market.”
The indicator’s plunge mirrors price action that topped near $126,000 in October 2025 and scraped $85,000 this week.
Key Levels Traders Are Eyeing
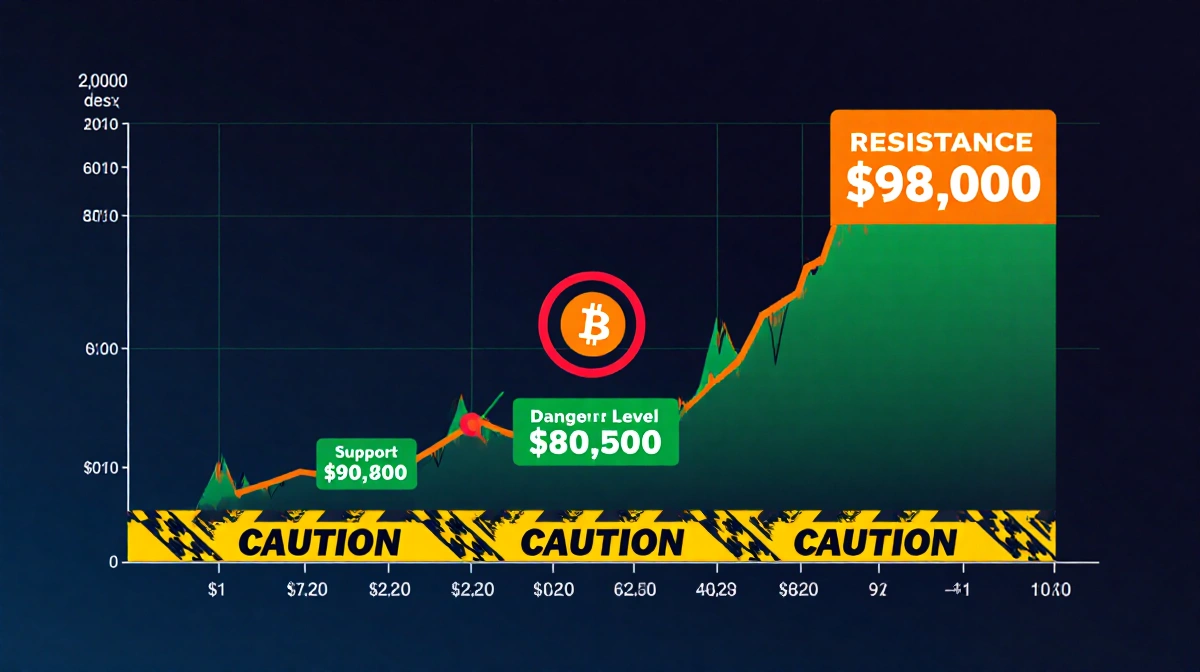
- Resistance: must reclaim $92,000 to reignite upside
- Support: CME gap at $88,000 and 21-day MA around $90,500
- Danger zone: lose $87,200 and $69,230 comes into play
| Level (USD) | Significance |
|---|---|
| 92,000 | Upside trigger |
| 88,000 | CME gap fill |
| 87,200 | Triangle floor |
| 69,230 | Downside target |
Why Price Feels ‘Stuck’
Dealers are reportedly hedging aggressively-selling rallies and buying dips-keeping BTC locked between $90,000 and $95,000. Van de Poppe calls the resulting tight channel a period of “boredom,” but warns structure stays intact only if the 21-day MA holds.
Key Takeaways
- The 3-day MACD has printed its lowest reading in Bitcoin’s history
- Bulls need a daily close above $92,000 to shift momentum
- A fall through $87,200 opens the door to $69,230
- Range-bound action may persist while dealer hedging caps volatility
With the rising-triangle pattern hanging in the balance, the next few daily closes could decide whether the record MACD low marks a selling climax or the start of another leg down.