> At a Glance
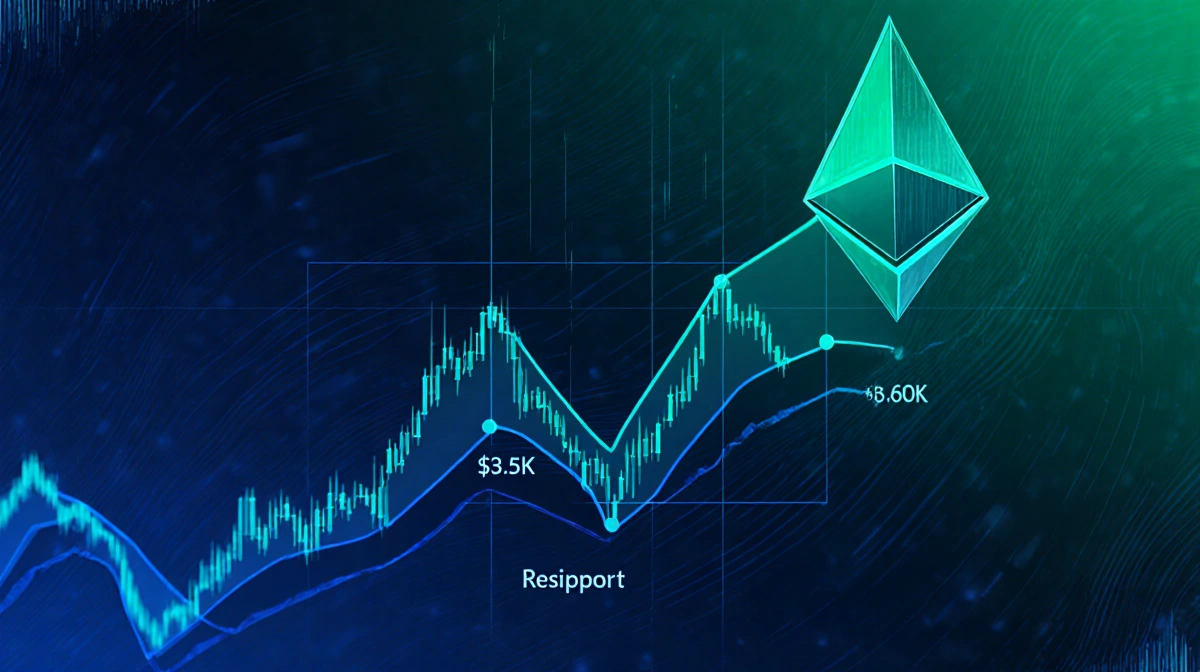
> – Ethereum is hovering near $3.1K while capped by a $3.5K supply zone
> – Binance leverage ratio hit an all-time high of 0.8, topping December’s peak
> – Price is wedged between a descending channel and a rising support trendline
> – Why it matters: Record leverage could fuel violent swings if ETH fails to break resistance
Ethereum is attempting to steady itself after months of declines, but fresh data shows derivatives traders are stacking risk to historic levels even as technical resistance looms just 13% above current prices.
Daily Chart Stays Bearish Below $3.5K
The daily chart shows ETH has nudged above a long-running descending channel, yet the move lacks momentum. The $3.5K region-where the 200-day moving average converges with former support-turned-resistance-has repeatedly rejected rallies since mid-2024.
Until the price records a daily close above that supply zone, News Of Los Angeles analysts treat every bounce as a corrective retracement rather than the start of a new uptrend.
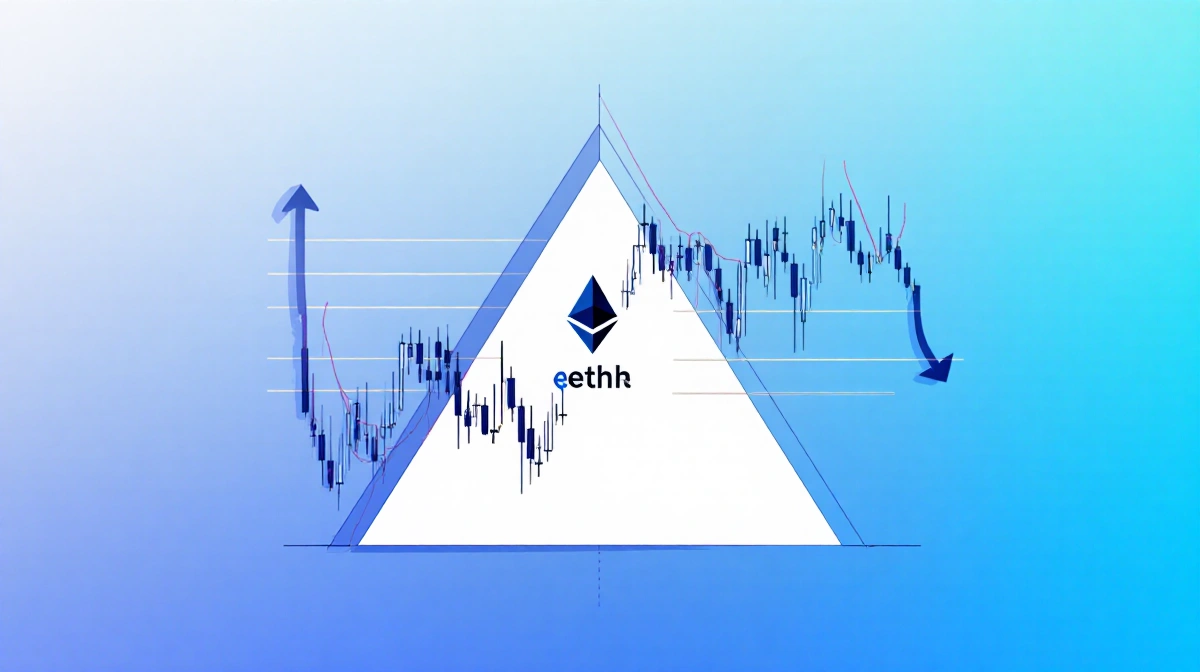
4-Hour Wedge Hints at Incoming Volatility
On the 4-hour timeframe, ETH is coiling inside a symmetrical wedge:
- Upper boundary descends from the late-May peak
- Lower boundary rises from the June low
- A measured breakout above $3.4K would target the wedge origin near $3.7K
- A breakdown through $2.95K could re-open the $2.7K June floor
The longer the pattern persists, the more violent the eventual resolution-especially with leverage at extremes.
Leverage Ratio Signals Fragile Equilibrium
Binance’s ETH Estimated Leverage Ratio surged to 0.8, eclipsing the prior record set in December. The metric compares futures open interest to exchange balances:
| Date | Leverage Ratio | Price Range |
|---|---|---|
| Dec 2023 | 0.78 | $2.1K-$2.4K |
| Jun 2024 | 0.80 | $3.0K-$3.4K |
High leverage historically precedes sharp two-way liquidations. A push toward $3.5K could trigger a short squeeze, while a failure to break out might spark cascading long liquidations and accelerate any pullback.
Key Takeaways
- $3.5K remains the line in the sand for a structural shift on the daily chart
- A 4-hour wedge breakout above $3.4K is needed to confirm bullish continuation
- Record leverage raises the odds of outsized moves in either direction
- Until resistance gives way, the path of least resistance stays neutral-to-bearish
With both technical and on-chain indicators pointing to an imminent expansion in volatility, ETH’s next major move could arrive once the wedge reaches its apex over the coming sessions.