
At a Glance
- Ethereum has broken out of a two-month symmetrical triangle on the daily chart
- The move reclaimed the $3,400-$3,600 resistance zone that had capped gains for weeks
- Futures open interest sits at $19.2B, indicating balanced leverage after recent liquidations
- Why it matters: A sustained push could target $4,000 as spot demand returns
Ethereum is flashing renewed technical strength after weeks of consolidation. The second-largest crypto has broken above a symmetrical triangle that confined price action since early March, clearing a path toward the 200-day moving average near $3,800.
Daily Chart Breakout
The symmetrical triangle that formed over the past two months has resolved to the upside. Price closed above the upper trendline with momentum confirmed by the RSI climbing back above 60.
Key levels now in focus:
- $3,400-$3,600 – reclaimed supply zone and former order block
- $3,800 – 200-day moving average, next major resistance
- $3,000 – first support on any pullback
- $2,700 – deeper support that must hold to keep bulls in control
A daily close above $3,600 would open room for a quick run at the 200-day MA. Failure to hold $3,000 would risk flipping the structure bearish.
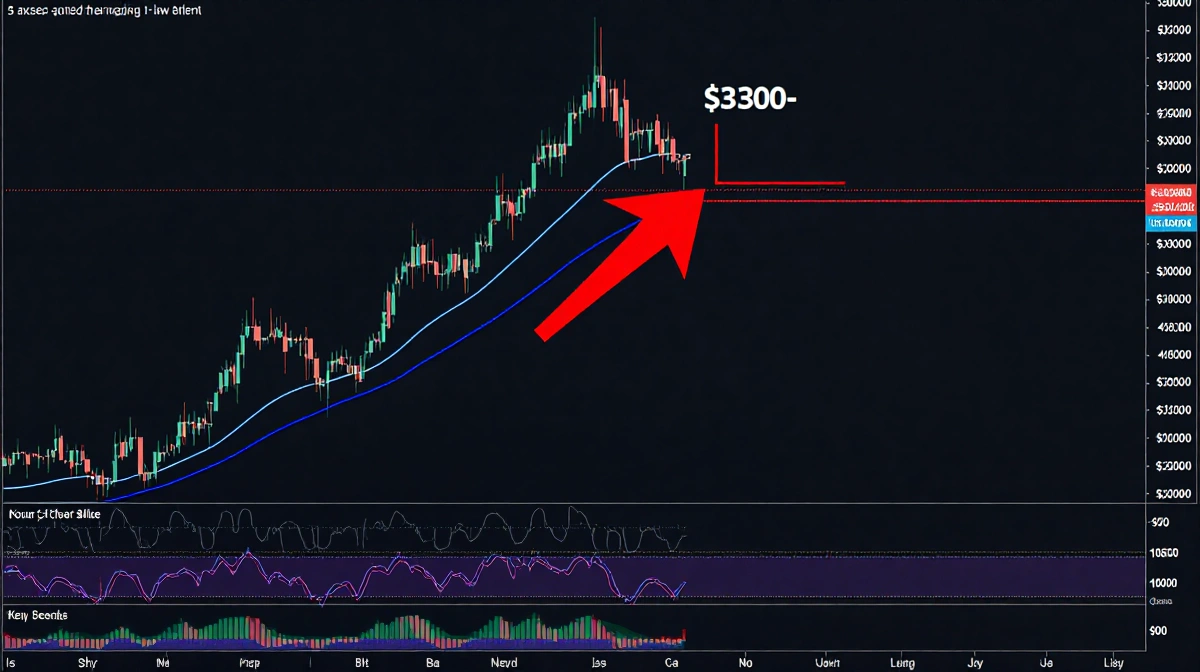
4-Hour View: Cooling After Spike
Zooming in, the 4-hour chart shows a decisive breakout through the $3,300-$3,500 ceiling that rebuffed buyers since late April. Price is now consolidating just above that band.
Momentum signals are mixed:
- RSI has pulled back from overbought territory, hinting at a pause
- Structure remains bullish as long as the zone near $3,200 holds
- A drop under that level would invalidate the breakout and expose $3,000
If bulls defend $3,200, the next leg targets the $3,600-$3,700 region.
Futures Market Reset
Open interest across derivatives exchanges has flattened near $19.2B. The sideways read indicates both longs and shorts have been squeezed during the recent chop, reducing the odds of a violent liquidation cascade.
With leverage washed out, spot buying could more easily translate into price gains. Market structure now favors an advance toward the psychologically key $4,000 mark if fresh demand materializes.
Key Takeaways
- Breaking the two-month triangle shifts medium-term bias higher
- First meaningful resistance sits at the 200-day MA around $3,800
- Support at $3,200 on the 4-hour chart must hold to keep the breakout intact
- Reset futures positioning lowers the risk of a leverage-driven selloff
The move aligns with broader crypto optimism as traders refocus on ETF progress, institutional inflows, and macro tailwinds. For now, ETH appears positioned to test higher levels barring a swift reversal below $3,200.