
> At a Glance
> – ETH reclaimed $3,000 after bouncing off $2,600 in mid-December
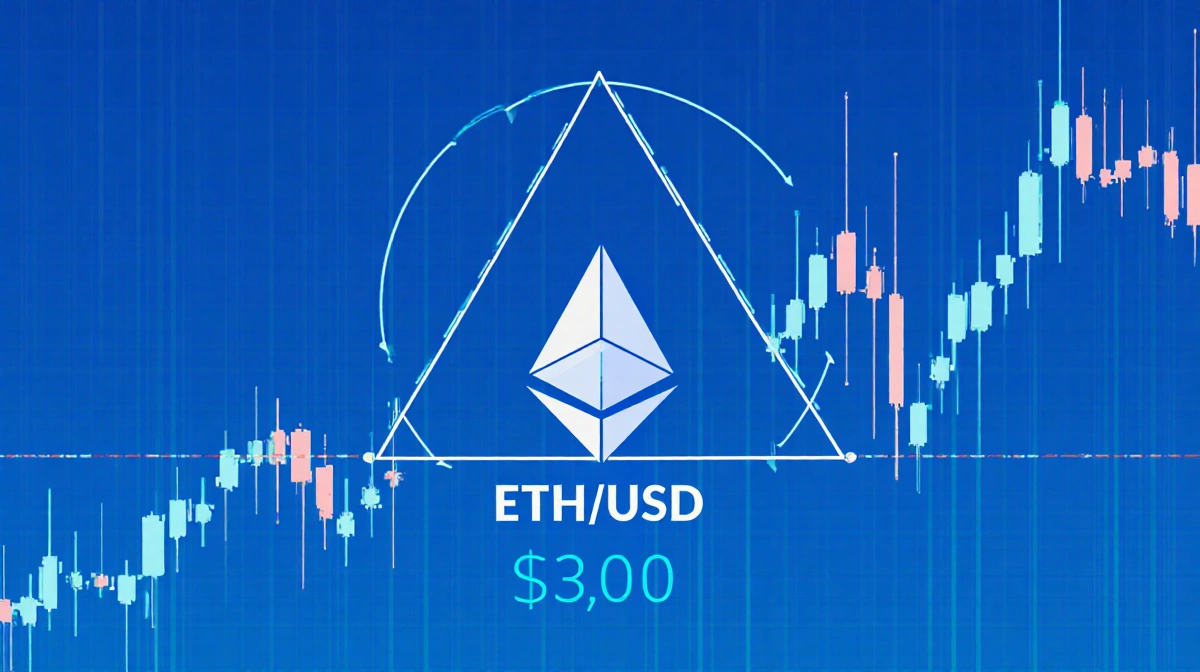
> – Price now squeezed inside a symmetrical triangle on the 4-hour chart
> – $3,500 resistance still caps the rally, lined up with 100- and 200-day MAs
> – Why it matters: A breakout from the triangle could decide whether the next move targets $4,000 or retests $2,500
Ethereum is trading flat but calm near $3,000 as global markets wrestle with Middle-East tensions, supply-chain snarls, and renewed US-China friction. Crypto sentiment has stayed surprisingly steady, and ETH derivatives data shows traders are still engaged without betting on extreme leverage.
Daily Chart: $3,500 Wall Holds the Keys
The climb from the $2,600 demand zone stalled just under $3,500, where the 100- and 200-day moving averages form a thick supply wall. A convincing close above that level would flip the medium-term bias bullish and expose the next resistance cluster around $4,000.
Momentum is fading: the daily RSI rolled over after December’s surge. If bulls fail to crack $3,500, another dip toward the $2,600 support base looks likely.
4-Hour View: Triangle Hints at Imminent Move
Zooming in, ETH is carving higher lows and lower highs inside a symmetrical triangle centered on $3,000.
- Lower trendline: ~$2,900
- Upper trendline: just under $3,300
Price is retesting the lower boundary after a minor pullback. A bounce could spark another run at the topside; a breakdown would open the $2,600-$2,500 demand band. RSI already slipped under 50, giving short-term edge to sellers if support cracks.
Derivatives Data: Calm Before the Move?
Open interest sits near $18 billion, down from Q3 2025 peaks but still elevated. The December rebound did not spark a leverage rush, lowering the odds of a forced-liquidation cascade if volatility spikes.
BTC dominance is creeping up, however, so ETH needs a high-volume push through $3,500 to reclaim the spotlight.
Key Takeaways
- $3,500 is the daily chart’s make-or-break level; above it eyes $4,000, below it risks $2,600
- 4-hour symmetrical triangle projects an imminent 10%-12% move once either trendline breaks
- Open interest remains healthy at $18B, showing traders are positioned but not over-levered
- Rising BTC dominance could keep ETH in a holding pattern until resistance gives way
With triangle converging and macro clouds looming, the next few sessions could decide whether Ethereum resumes its up-trend or revisits year-to-date lows.