At a Glance
- Humans ingest an estimated 39,000-52,000 microplastic particles yearly, found in 8 of 12 organ systems.
- Seafood, tea bags, rice, and bottled water are the top sources.
- No safe intake level is established, but steps can reduce exposure.
Why it matters: Understanding where microplastics enter the diet helps consumers make informed choices to protect health.
The presence of microplastics in everyday foods has raised concerns among scientists and the public alike. A 2024 review revealed that people can swallow tens of thousands of tiny plastic particles each year, with eight organ systems potentially affected. While the health risks are still being studied, the sheer ubiquity of microplastics in the food chain urges a closer look at common dietary items.
How Much Microplastic Are We Eating?
The latest estimates suggest that each person consumes 39,000-52,000 microplastic particles annually. A scoping review identified microplastics in 8 of 12 human organ systems, indicating widespread distribution. The main routes of entry are:
- Air, water, and food preparation surfaces.
- Food itself, especially items processed or packaged with plastic.
- Contaminated irrigation or soil used in agriculture.
Because there is no officially established safe level, experts recommend minimizing intake where possible.
Top Foods With Microplastics
Below are the eight foods most likely to contain microplastics, along with practical tips to reduce exposure.
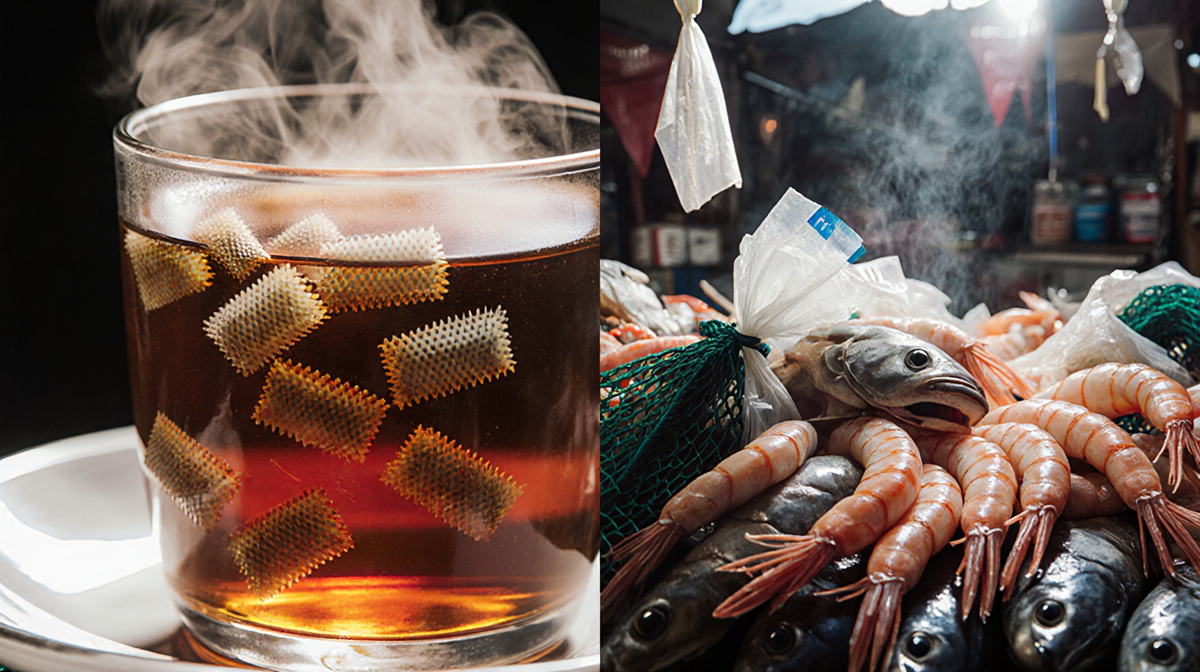
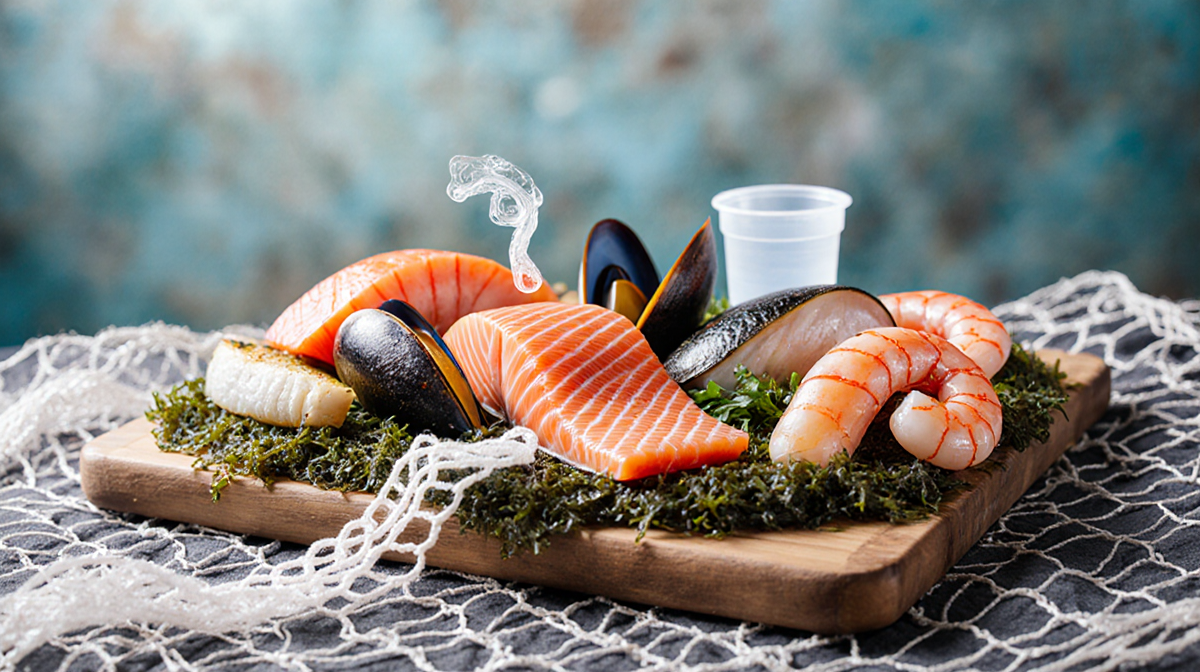
1. Seafood
Single-use plastics break down in waterways, enter oceans, and are taken up by plankton. Fish and shellfish mistake these particles for food, accumulating them in their flesh.
- Study: Portland State University found microplastics in 180 of 182 seafood samples.
- Common types: Microfibers are most frequent.
- Avoid: Reduce consumption of filter feeders and bottom feeders such as clams, mussels, oysters, catfish, halibut, flounder, and cod.
- Choose: Seafood sold in sustainable packaging rather than plastic wrap.
2. Tea Bags
Polypropylene tea bags release billions of plastic particles when steeped. Even paper bags can shed microplastics.
- Research: Autonomous University of Barcelona measured releases in the billions for polypropylene and millions for nylon or cellulose.
- Avoid: Switch to loose-leaf tea and use a stainless-steel diffuser.
3. Rice
Rice grains can contain microplastic contamination from irrigation water and processing.
- Findings: University of Queensland study reported 3-4 mg of plastic per half cup of rice; instant rice packets reached 13 mg.
- Reduce: Washing rice cuts contamination by 20-40% when rinsed with filtered water.
4. Salt and Sugar
These staples can carry microplastics from environmental contamination and packaging.
- Data: A study found 90% of 39 salt brands worldwide contained microplastics.
- Avoid: Purchase salt and sugar in glass or cardboard containers.
5. Bottled Water
Plastic bottles made of PET degrade into micro- and nanoplastics.
- Estimate: About 240,000 plastic particles per liter.
- Reduce: Drink tap water stored in stainless-steel or glass containers.
6. Honey
Bees can ingest microplastics, which then appear in honey.
- Study: Bees carried microplastic fibers into hives, contaminating the honey.
- Avoid: Buy honey from local beekeepers who use natural harvesting methods.
7. Fruits and Vegetables
Plants can absorb micro- and nanoplastics from soil.
- Survey: Apples and carrots were the most contaminated produce.
- Avoid: Wash thoroughly, peel when possible, and choose local or organic options.
8. Proteins
Highly processed proteins-plant-based nuggets, fish sticks, chicken nuggets-show the highest microplastic counts.
- Study: Ocean Conservancy researchers found 88% of protein sources contained microplastics.
- Examples: Breaded shrimp averaged 300 pieces per serving; plant-based nuggets averaged 100.
- Note: More research is needed on health impacts.
Health Implications
While definitive health outcomes remain uncertain, microplastics can accumulate in the circulatory system and organs, including the brain. Potential effects include:
- Inflammation and tissue damage.
- Hormonal imbalances from endocrine-disrupting chemicals.
- Transport of environmental toxins into the body.
Because microplastics are pervasive, reducing intake where feasible is prudent.
Practical Ways to Cut Exposure
- Limit shellfish: Choose lower-contaminated options.
- Avoid plastic food-storage: Store fatty foods in glass; dry foods may stay in plastic.
- Eliminate plastic-wrapped foods: Opt for packaging free of plastic.
- Use non-plastic utensils: Replace plastic spoons, cutting boards, and mixers with ceramic, glass, stainless steel, or wood.
- Install washing-machine filters: A microfiber filter can trap microfibers before they enter waterways.
- Choose water filters that target microplastics: Some pitchers and bottles claim to remove 99.999% of microplastics.
## Key Takeaways
- Microplastics are found in a wide array of foods and beverages.
- No safe intake level has been established, but reducing exposure is advisable.
- Simple changes-such as selecting loose-leaf tea, washing rice, and avoiding plastic containers-can lower daily microplastic consumption.
- Continued research is essential to understand long-term health effects.
By staying informed and making small adjustments, consumers can reduce their microplastic exposure while maintaining a balanced diet.