
> At a Glance
> – XRP reclaimed $2.00 after holding $1.8 support
> – Daily RSI tops 60, hinting at rising momentum
> – Against BTC, price targets 2,500 sats supply zone
> – Why it matters: A channel breakout could trigger the next leg higher for holders
XRP is flashing early signs of recovery as 2026 trading kicks off, snapping a lengthy slide and drawing fresh attention from swing traders.
USDT Pair Setup
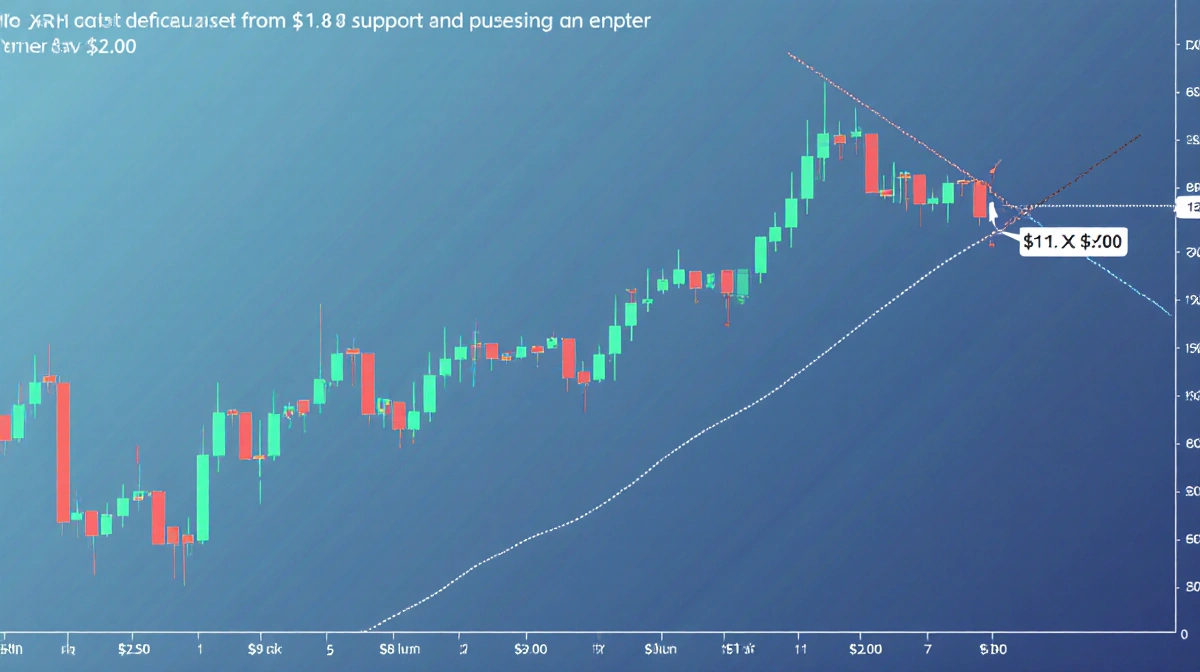
The daily chart shows XRP reversing from the $1.8 support and now pressing against the upper edge of a descending channel near $2.00.
The 100- and 200-day moving averages hover above $2.30, forming a dynamic resistance cluster. A decisive push through that area opens room toward the next notable supply region around $2.50.
- RSI has climbed above 60, reflecting strengthening momentum
- The oscillator nears overbought space, raising odds of a brief pause
- Channel breakout remains the key technical catalyst
BTC Pair Momentum
XRPBTC has jumped from the 2,000 sat mid-range floor to 2,230 sats and now eyes the 2,500 sat ceiling.
December’s bearish cross of the 100- below the 200-day MA keeps the long-term gradient negative, yet the sharp RSI uptick implies aggressive short-covering.
| Key Metric | Current | Resistance/Target |
|---|---|---|
| XRP/USDT price | $2.00 | $2.30 – $2.50 |
| XRP/BTC price | 2,230 sats | 2,500 sats |
| RSI (USDT pair) | 60+ | 70 (overbought) |
Sustained buying would challenge the moving-average band that has capped rallies since late last year.
Key Takeaways
- Bulls must clear $2.30-$2.40 to confirm trend reversal
- BTC pair faces its next test at 2,500 sats
- Short-term consolidation is possible as RSI approaches overbought conditions
XRP’s ability to convert these resistance layers into support will decide whether the recent bounce evolves into a fuller recovery phase.