
> At a Glance
> – XRP surged from the $1.8 demand zone, snapping a multi-month downtrend
> – Next major ceiling sits at $2.4-$2.5 on the daily chart
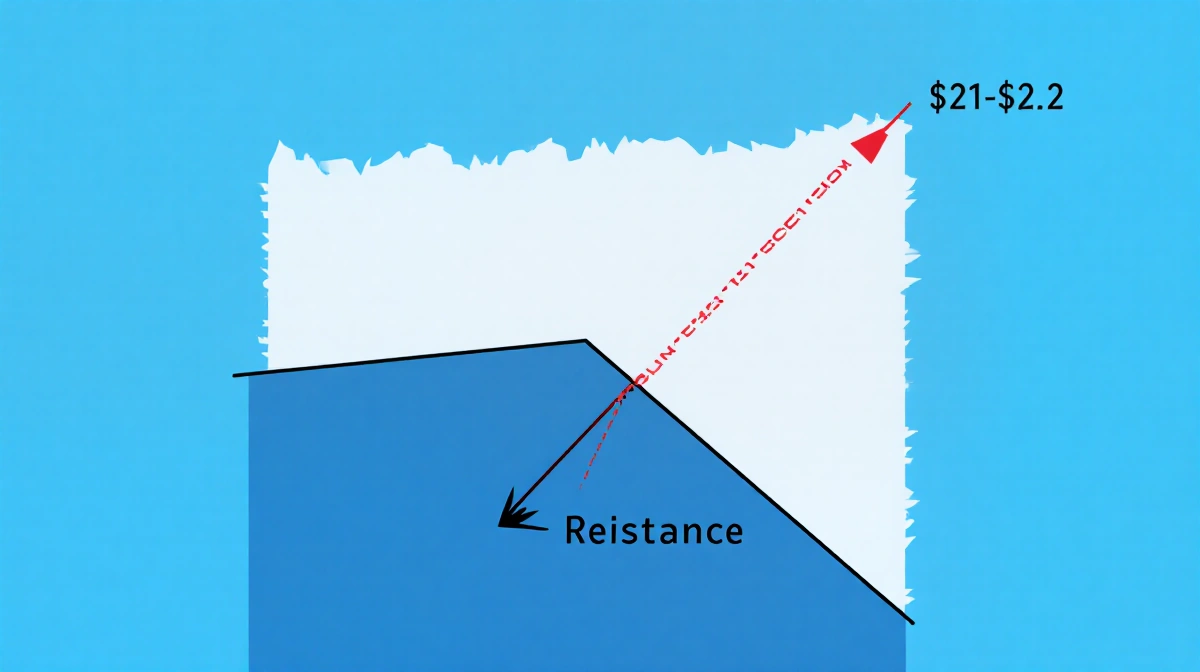
> – 4-hour view shows immediate resistance between $2.1-$2.2
> – Why it matters: A close above these levels could confirm a broader recovery instead of another range-bound trap
XRP has flipped the script after weeks of lower highs. The latest rally lifted price out of a descending channel, but two clear resistance layers now stand in the way.
Daily Chart: $2.5 Wall Looms
Buyers defended the $1.8 demand zone once again, producing a bullish breakout that reclaimed the psychological $2 handle. The 200-day moving average and a supply band intersect around $2.4-$2.5, making that region the next major battleground. A daily close above it would strengthen the case for a sustained uptrend; failure keeps XRP locked in its wide $1.8-$2.5 range.
4-Hour Chart: Compression Break
Price chopped sideways for days above the buyer’s base, forming a tight compression pattern. The eventual pop pierced the descending channel and held, marking a clear momentum shift. Current resistance at $2.1-$2.2 aligns with prior swing highs and the local moving-average cluster.
- Hold above $2.1 → bullish structure intact
- Lose $2.1 → probable retest of $1.8 support
| Timeframe | Resistance Zone | Technical Significance |
|---|---|---|
| 4-Hour | $2.1-$2.2 | Recent supply, MA confluence |
| Daily | $2.4-$2.5 | 200-MA, major swing highs |
Key Takeaways
- XRP exited its descending structure after aggressive buying near $1.8
- The daily $2.4-$2.5 barrier must flip to support for macro recovery
- Short-term traders watch $2.1; a break higher targets the daily ceiling
- Failure to extend could send price back toward the proven $1.8 floor
Market structure has improved, but acceptance above $2.5 on a daily closing basis is required to confirm the rally has legs.