XRP remains in a corrective phase within the broader crypto market, with recent volatility failing to alter the prevailing medium-term downtrend. The price action across both the USD and BTC pairs continues to trade below key moving averages, indicating that strength in early January has so far been contained within a larger distribution structure rather than establishing a sustained trend reversal.
At a Glance
- XRP fell from $2.40 resistance to $1.80 support level
- Daily RSI dropped below 50, signaling bearish momentum shift
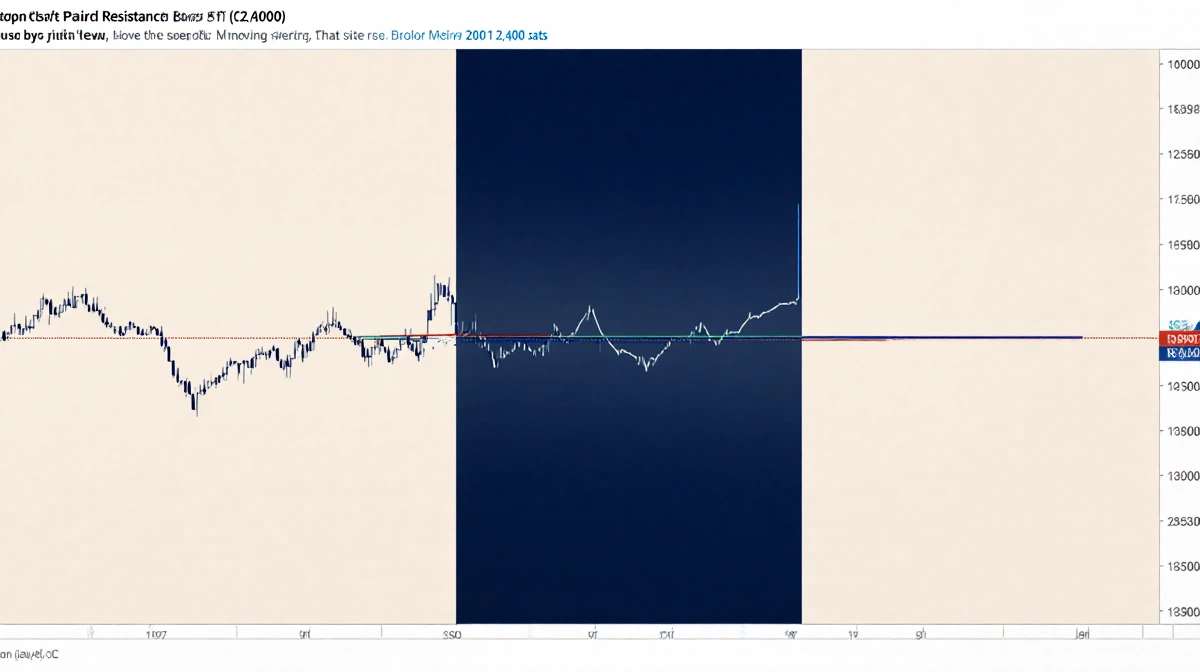
- XRPBTC pair rejected at 2,400 sats resistance level
- Why it matters: Traders face potential further downside toward $1.50 if current support fails
The technical structure shows XRP struggling to maintain any meaningful recovery, with both USD and Bitcoin trading pairs reflecting sustained selling pressure. The rejection from key resistance levels has pushed the token back toward critical support zones that have historically provided buying interest.
The USDT Pair Analysis
On the XRP/USDT pair, the sharp rejection from the $2.40 resistance block and the declining 100-day and 200-day moving averages have pushed the price back toward the $1.80 demand zone, which has repeatedly acted as a major horizontal support.
The Daily RSI has also cooled from overbought conditions and is now below 50, signalling that momentum has rotated from aggressive short covering back to a negative stance. As long as the price remains capped beneath the confluence of the 100-day MA and the $2 supply region, the broader structure continues to resemble a series of lower highs within a downtrend, with risk of a deeper revisit of the $1.50 area or even lower if the current support cluster fails to hold.
Key technical levels to watch:
- Resistance: $2.40 (previous rejection point)
- Immediate support: $1.80 (current demand zone)
- Downside target: $1.50 (if support breaks)
- RSI level: Below 50 (bearish momentum)
The BTC Pair Analysis
On the XRPBTC pair, structural underperformance versus Bitcoin persists. The pair has been rejected once again from the 2,400 sats resistance band, where the key 200-day moving average is located and acts as a dynamic overhead supply.
The subsequent sell-off has driven the price back below the 100-day moving average (located around the 2,200 sats mark) and toward the lower half of the multi-month range around 2,000 sats, with a notable downside wick signalling initial dip-buying interest but not yet a confirmed reversal.
Unless the pair can establish a higher low above the major 2,000 sats support level and reclaim the key moving averages, relative strength is expected to remain tilted in favour of Bitcoin, and any bounces on the BTC pair are likely to be treated as corrective within a dominant bearish trend.
Technical Outlook
The current price action suggests XRP faces an uphill battle for any meaningful recovery. Both trading pairs show the cryptocurrency trading below crucial moving averages, a technical setup that typically favors continued downside pressure.
For the USDT pair, the failure to sustain above $2 combined with RSI below 50 indicates bearish momentum remains intact. The repeated tests of the $1.80 support level increase the probability of a breakdown toward $1.50.
Similarly, the XRPBTC pair’s inability to break above 2,400 sats resistance highlights the ongoing weakness relative to Bitcoin. The rejection from the 200-day moving average reinforces the bearish structure, with 2,000 sats serving as the last line of defense before potentially deeper losses.
Market Structure Assessment
The broader structure across both pairs continues to resemble a distribution phase rather than accumulation. The series of lower highs and failed breakout attempts suggests sellers remain in control of the trend direction.
This technical backdrop indicates that any rallies toward resistance levels should be viewed with caution, as the probability favors continued downside until a decisive break above key moving averages occurs with sustained volume.
The analysis points to a market where dip buyers have shown interest at support levels but lack the momentum to drive sustainable recovery. This dynamic creates a range-bound environment with a slight bearish bias until proven otherwise by price action.