
At a Glance
- XRP faces immediate rejection at the $2.00 resistance block on the daily chart
- The asset was recently turned away from the 100-day moving average and still trades below the 200-day MA
- Against Bitcoin, XRP has retreated to 2,180 sats after failing to hold above key moving averages
- Why it matters: The price action suggests the recent bounce is a relief rally, not a trend reversal, leaving traders watching for a daily close above $2.40 to confirm bullish momentum
XRP’s latest upswing has lifted prices from the $1.80 demand zone to the psychological $2.00 level, but follow-through buying has evaporated at exactly the area where longer-term sellers typically emerge. The rejection leaves the token stuck between rising short-term optimism and a still-intact medium-term downtrend.
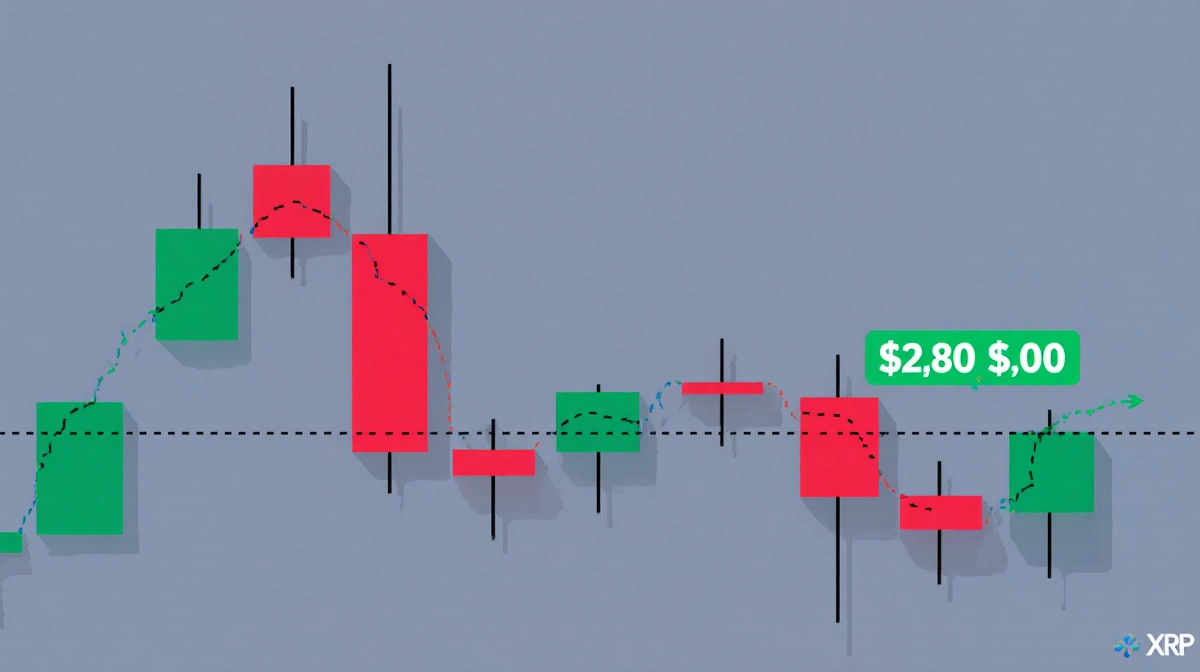
USD Chart: $2.00 Caps the Relief Rally
The daily XRP/USDT chart shows a sharp bounce off the $1.80 low, yet the rally stalled the moment price reached the $2.00 resistance block. Sellers promptly emerged, leaving the candlesticks struggling to close above that threshold.
Key observations:
- The 100-day moving average acted as an immediate ceiling, rejecting the rally and reinforcing the bearish structure
- The 200-day moving average sits even higher, adding another layer of dynamic resistance
- RSI briefly tagged overbought territory before curling downward, aligning with the idea of a relief rally rather than a fresh uptrend
For buyers to regain control, XRP must hold inside or just above the $2.00 area and eventually post a clean daily close above $2.40. Until that happens, the prevailing view remains that the move is a counter-trend bounce within a broader decline.
BTC Pair: Underperformance Versus Bitcoin
Measured in satoshis, XRP shows clear weakness. The token spiked above 2,500 sats only to be rejected, and it now trades around 2,180 sats.
Critical levels:
- 2,500 sats supply zone rejected price and remains a key hurdle
- Both the 100-day and 200-day moving averages sit overhead as resistance
- The recent fake-out above those averages, followed by swift selling, fits the definition of a distribution phase
Liquidity was grabbed higher before the token fell back into its prior range. The immediate support to watch is 2,000 sats. A daily close back above the 100-day moving average and a reclaim of the 2,500 sats region would be required to argue that XRP is gaining genuine relative strength against Bitcoin. At present, that outcome appears unlikely.
Market Sentiment Reset, But Not Reversed
The bounce was strong enough to squeeze shorts and reset sentiment from extreme fear to neutral, yet positioning data shows traders are not rushing back into longs. Open interest has ticked higher, but funding rates remain flat, indicating a wait-and-see approach.
Price action summary:
- $1.80 demand zone held on the first test
- $2.00 resistance block rejected price on the first test
- $2.40 remains the next major upside trigger
A sustained break above $2.40 on volume would shift the near-term bias toward bulls, while a drop back below $1.80 would expose the $1.60 swing low from earlier in the month.
Key Takeaways
- XRP’s rally has paused at $2.00, a level that has repeatedly acted as resistance since late December
- The token trades below both the 100-day and 200-day moving averages, keeping the medium-term trend tilted downward
- Against Bitcoin, XRP shows ongoing weakness, with 2,000 sats as the line in the sand
- Traders are now watching for either a daily close above $2.40 to confirm upside momentum or a fall below $1.80 to signal another leg lower
News Of Losangeles reached out for comment but had not received a response by press time.