
At a Glance
- XRP slides back to resistance zones after a brief rebound.
- Key upside thresholds are at $2.40 and 2,400 sats.
- The coin’s direction will depend on daily closes and support levels.
- Why it matters: Traders must decide whether XRP can maintain a base or will fall into deeper support.
XRP is in a corrective phase, sliding back to resistance levels after a brief rebound. The coin’s future hinges on whether it can reclaim key upside thresholds or slide into deeper support zones. Traders will watch moving averages and daily closes for clues.
XRP Price Analysis: USDT Pair
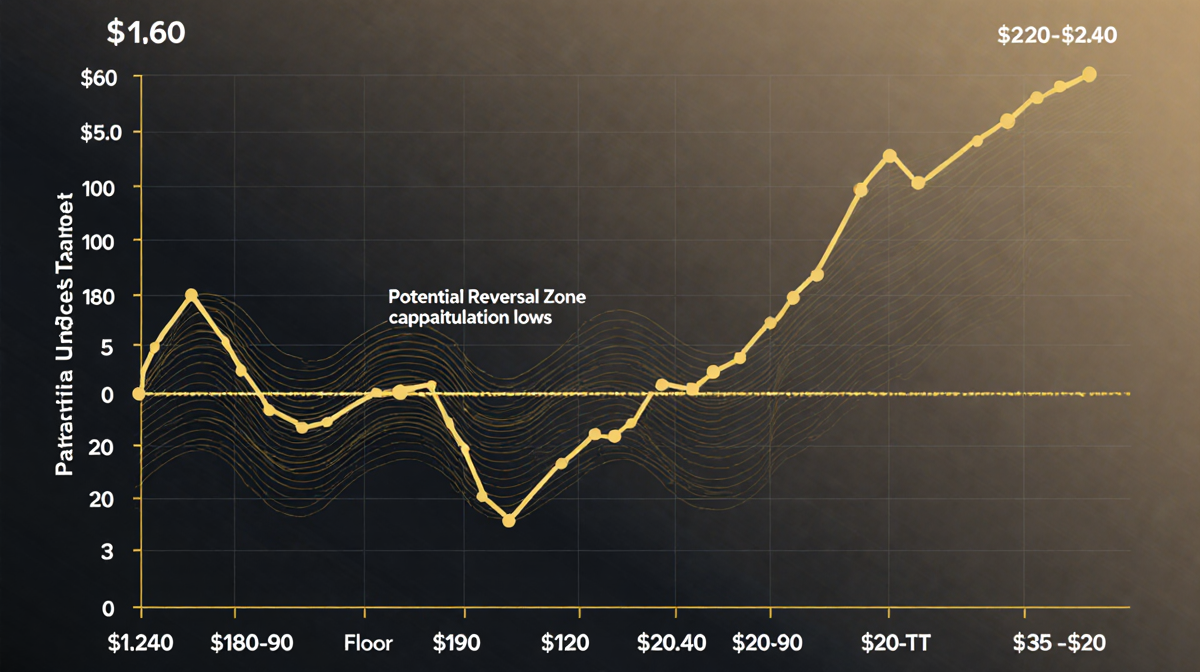
On the daily chart, XRP/USDT is trading just above the major horizontal demand zone around $1.80-$1.90 after being rejected from the $2.40 supply band and the declining 100-day and 200-day moving averages. The moving averages continue to slope lower, confirming a medium-term bearish bias, while daily RSI has cooled from overbought levels back toward neutral, consistent with a fading bounce.
As long as the $1.80-$1.90 floor holds, the structure can still evolve into a basing range, with $2.20-$2.40 as the first upside threshold that must be reclaimed to argue for trend reversal; a decisive daily close below $1.80 would instead open room toward the October capitulation lows around $1.60 and, if pressure persists, the higher-timeframe lower demand zone near $1.20-$1.30.
Key Levels for USDT Pair
- Floor: $1.80-$1.90
- First upside target: $2.20-$2.40
- Potential reversal zone: $1.60 (October capitulation lows)
- Long-term support: $1.20-$1.30
The BTC Pair
Against Bitcoin, the XRP/BTC pair is hovering around 2,100-2,200 sats mark after a sharp rejection from the 2,400 sats resistance band and the cluster of the 100-day and 200-day moving averages. The pair remains locked in a structural downtrend, with each rally into the 2,400-2,500 sats area repeatedly sold and momentum failing to establish higher highs.
The lower support zone lies around 1,900-2,000 sats, where a recent downside wick indicates some demand, but until daily closes reclaim at least the 2,400-2,500 sats region and the key moving averages, relative performance continues to favor BTC. A breakdown below 1,800 sats would confirm renewed underperformance and could extend the slide toward the prior major demand area closer to 1,500 sats.
Key Levels for BTC Pair
| Level | Description |
|---|---|
| 2,100-2,200 sats | Current trading range |
| 2,400-2,500 sats | Resistance band and upside target |
| 1,900-2,000 sats | Lower support zone |
| 1,800 sats | Break-down trigger |
| 1,500 sats | Prior major demand area |
Special Offer
Exclusive for readers: Use the link to register and unlock $1,500 in exclusive BingX Exchange rewards (limited time offer). Disclaimer: Information found on the platform is those of writers quoted. It does not represent the opinions of the platform on whether to buy, sell, or hold any investments. You are advised to conduct your own research before making any investment decisions. Use provided information at your own risk. See Disclaimer for more information.
Key Takeaways
- XRP remains in a corrective phase, with daily closes around $1.80-$1.90.
- Moving averages slope lower, signaling medium-term bearish bias.
- The first upside target is $2.40; failure to reach it could push XRP toward deeper support.
- In BTC terms, the pair hovers near 2,100-2,200 sats, with resistance at 2,400-2,500 sats.
- A breakdown below 1,800 sats on the BTC pair would confirm a renewed downtrend.
- Traders should monitor daily closes and support levels for potential trend changes.
—
This article is based solely on the information provided and does not include additional context or speculation beyond the facts presented.