> At a Glance
> – XRP trades at $2.28, down 3% in 24 hours but up 20% on the week
> – Key support at $2.27 held after a sharp drop to $2.21 early Tuesday
> – $2.66 becomes the next upside target if $2.32 resistance breaks
> – Why it matters: A weekly close above the EMA ribbon around $2.37 has historically signaled larger rallies
XRP is hovering at $2.28 after buyers rushed in near the $2.27 Fibonacci support, setting up a fresh test of the $2.31-$2.32 resistance band.
Support at $2.27 Holds
The price slid from $2.41 overnight but bounced quickly off the 0.236 Fibonacci retracement at $2.27. Crypto analyst Tara flagged the level as “critical,” noting that a rising moving average is now converging on the same zone.
If buyers reclaim $2.32, watch these extension targets:
- $2.49 (initial Fibonacci extension)
- $2.66 (next major extension)
A daily close below $2.27 opens the door to:
- $2.18 (0.382 retracement)
- $2.11 (subsequent support)
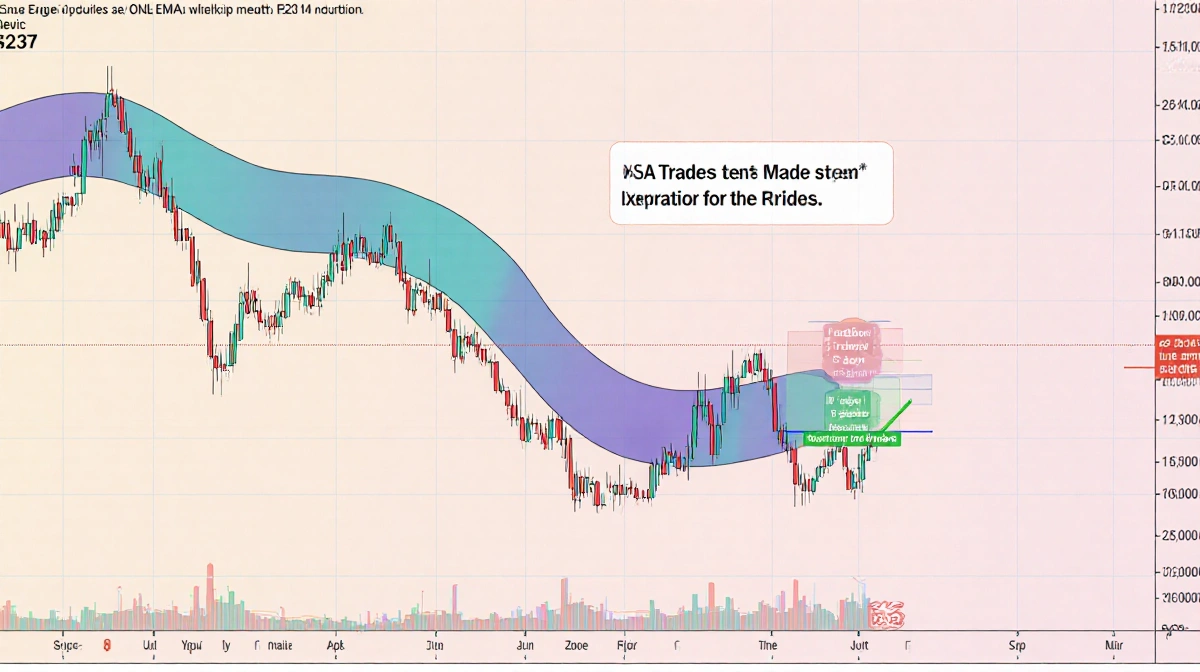
Weekly EMA Ribbon Test
On the weekly chart, XRP is challenging the EMA ribbon near $2.37. The asset has traded beneath this technical layer for months; flipping it would mark a structural shift.
Steph Is Crypto emphasized the stakes:
> “$XRP IS TRYING TO RECLAIM THE WEEKLY EMA RIBBON. THIS IS A BIG MOMENT.”
Historical data shows that prior breaks above the ribbon coincided with sustained uptrends.
Relative Strength vs Bitcoin
The XRP/BTC pair is nearing a monthly breakout above the Ichimoku Cloud, a level last crossed in 2018. Chartist The Great Mattsby highlights that such a move would indicate improving relative strength for XRP.
On-Chain Backdrop
Large-wallet activity is ticking higher, while spot-based Ripple ETFs have recorded steady inflows for almost two months. Combined, these flows have helped keep prices above $2.00 and could provide fuel for another leg if support remains intact.
Key Takeaways
- $2.27 is the immediate line in the sand; a weekly close below risks deeper correction
- A break above $2.32 targets $2.66 on the Fibonacci map
- Reclaiming the weekly EMA ribbon has historically triggered multi-week rallies
- Improving XRP/BTC structure and ETF inflows add underlying bid
The next 48 hours could decide whether $2.66 becomes the next stop or if sellers drag the token toward $2.11.